5CO02 Assignment Example

Solutions Available

Task 2- Quantitative and Qualitative Analysis

AC 2.1 With reference to a people practice issue, interpret analytical data using appropriate analysis tools and methods.

Table 1

a. Percentage of each gender by type  

  Total  Calculation  
    (Total/260)* 100 Percentages
Male 140 (140/260)*100 53.84
Female 118 (118/260)*100 45.38
Non-binary 2 (2/260)*100 0.769
Total 260    

  The table above represents gender percentages. The male employees represent 53.84% of the total employee population, female 45.38% and non-binary 0.76%

b. Ethnicity as a percentage per team Ethnicity as a percentage per team

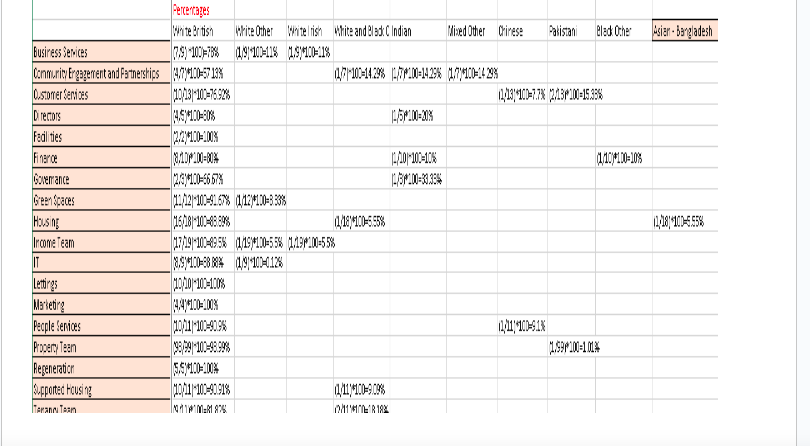
As per the above, the white British employees contain the highest team percentage since they occupy all job units. This is in comparison to other minority ethnic groups such as Chinese, Black other, Asian-Bangladesh and mixed other which have low population percentage.  

c. Disability percentage as an organisational whole and by teams.

Organisational Whole  

  Total Calculation  
    (Total/260)* 100 Percentage
Not Disabled 239 (239/260)*100 91.92
Disabled 21 (21/260)*100 8.07
Total 260    

  The diagram shows disability percentage calculations for disability percentage as a whole organisation with an employee population of 260. For instance, disabled employees represented 8.07% whereas the percentage of the non-disabled employees is 91.92%.

Disability percentage as an organisational team  

             
    Calculation Percentages Calculation Percentages
  Disabled   (Total/Number per team)* 100 Disabled Not disabled (Total/Number per team)* 100 Not Disabled
Business Services 0 (0/9)*100 0.00 9 (9/9)*100 100.00
Community Engagement and Partnerships 1 (1/7)*100 14.29 6 (6/7)*100 85.71
Customer Services 3 (3/13)*100 23.08 10 (10/13)*100 76.92
Directors 0 (0/5)*100 0.00 5 (5/5)*100 100.00
Facilities 0 (0/2)*100 0.00 2 (2/2)*100 100.00
Finance 2 (2/10)*100 20.00 8 (8/10)*100 80.00
Governance 0 (0/3)*100 0.00 3 (3/3)*100 100.00
Green Spaces 1 (1/12)*100 8.33 11 (11/12)*100 91.67
Housing 2 (2/18)*100 11.11 16 (16/18)*100 88.89
Income Team 1 (1/19)*100 5.26 18 (18/19)*100 94.74
IT 2 (2/9)*100 22.22 7 (7/9)*100 77.78
Lettings 1 (1/10)*100 10.00 9 (9/10)*100 90.00
Marketing 0 (0/4)*100 0.00 4 (4/4)*100 100.00
People Services 2 (2/11)*100 18.18 9 (9/11)*100 81.82
Property Team 5 (5/14)*100 35.71 9 (9/14)*100 64.29
Regeneration 0 (0/5)*100 0.00 5 (5/5)*100 100.00
Supported Housing 0 (0/11)*100 0.00 11 (11/11)*100 100.00
Tenancy Team 1 (1/11)*100 9.09 10 (10/11)*100 90.91

  The above data show that the non-disabled employees have a higher employee population rate in the teams than the disabled workers. The disabled have no presence in some teams such as business service, supported housing, regeneration and marketing. However, they are limited in departments such as the tenancy team with 9.09%, lettings 10% and property team 35.71%.  

d. Salary difference across genders.

  Total number Total Salary Calculation Average Salary
      (Total Salary/ Total number)  
Non-Binary 2 $39000 (39000/2) $19500
Males  140 $4453705 (4453705/140) $31812.18
Females 118 $3764235 (3764235/118) $31900.3
         

  The above data shows that male workers receive a higher total salary of £4453705 than female and non-binary workers who received £3764235 and £39000 respectively.  

e. Overall average salary paid by the organisation.

  Total Number Total Salary Calculation Average Salary
      (Total Salary/Total Number)  
Non-Binary 2 £39000 (39000/2) £19500
Males  140 £4453705 (4453705/140) £31812.18
Females 118 £3764235 (3764235/118) £31900.3
         
Totals  260 £8256940 (8256940/260) £31757.46

  The average salary paid to the non-binary workers is £19500, male workers at £31812.18, and female workers at £31900.3. Table Two: Percentage Feedback scores from a recent employee survey on hybrid working practices

Table 2. % Feedback scores from a recent employee survey on hybrid working practices. 
  1   2   3   4   5  
The ratings shown represent statements on a scale of 1-5 where: 1 = fully agree, 2 = agree, 3 = not sure, 4 = disagree, 5 = strongly disagree.  Feedback from 300 employees
        Total  Calculation= (Total/300)*100%  Total  Calculation= (Total/300)*100%  Total  Calculation= (Total/300)*100%  Total  Calculation= (Total/300)*100%  Total  Calculation= (Total/300)*100%
                           
I enjoy working for home on some days of the week 112 (112/300)*100=37.33% 57 (57/300)*100=19% 19 (19/300)*100=6.33% 94 (94/300)*100=31.33% 18 (18/300)*100=6%
Hybrid working practices support my work-life balance and well-being. 161 (161/300)*100=53.67% 86 (86/300)*100=28.67% 11 (11/300)*100=3.67% 34 (34/300)*100=11.33% 8 (8/300)*100=2.67%
I miss engaging with my colleagues in the workplace 7 (7/300)*100=2.33% 14 (14/300)*100=4.67% 30 (30/300)*100=10% 155 (155/300)*100=51.67% 94 (94/300)*100=31.33%
I feel fully supported when working at work 22 (22/300)*100=7.33% 20 (20/300)*100=6.67% 18 (18/300)*100=6% 138 (138/300)*100=46% 102 (102/300)*100=34%
I find working remotely a challenge 10 (10/300)*100=3.33% 63 (63/300)*100=21% 101 (101/300)*100=33.67% 53 (53/300)*100=17.67% 73 (73/300)*100=24.33%
I find it difficult to separate work from my personal life when working from home  98 (98/300)*100=32.67% 95 (95/300)*100=31.67% 23 (23/300)*100=7.67% 70 (70/300)*100=23.33% 14 (14/300)*100=4.67%
Hybrid working practices make me more productive 69 (69/300)*100=23% 79 (79/300)*100=26.33% 5 (5/300)*100=1.67% 82 (82/300)*100=27.33% 65 (65/300)*100=21.67%
Working from home does not affect cross functional  communication and collaboration with my team 62 (62/300)*100=20.67% 54 (54/300)*100=18% 5 (5/300)*100=1.67% 78 (78/300)*100=26% 101 (101/300)*100=33.67%
Since hybrid working has been in place, I feel more connected to our company culture.  8 (8/300)*100=2.67% 178 (178/300)*100=59.33% 3 (3/300)*100=1% 39 (39/300)*100=13% 72 (72/300)*100=24%
Working from home allows me to meet my targets 41 (41/300)*100=13.67% 60 (60/300)*100=20% 1 (1/300)*100=0.33% 57 (57/300)*100=19% 142 (142/300)*100=47.33%
I can easily access resources at home 47 (47/300)*100=15.67% 100 (100/300)*100=33.33% 6 (6/300)*100=2% 35 (35/300)*100=11.67% 112 (112/300)*100=37.33%
Working from home removes conflict 90 (90/300)*100=30% 87 (87/300)*100=29% 7 (7/300)*100=2.33% 27 (27/300)*100=9% 89 (89/300)*100=29.67%
I feel less stressed when away from the workplace 41 (41/300)*100=13.67% 4 (4/300)*100=1.33% 0 (0/300)*100=0% 5 (5/300)*100=1.67% 250 (250/300)*100=83.33%
I get the same amount of recognition about my work when working from home 70 (70/300)*100=23.33% 69 (69/300)*100=23% 2 (2/300)*100=0.67% 71 (71/300)*100=23.67% 88 (88/300)*100=29.33%

  The table above contains data obtained from a recent employee survey on hybrid practices. Some employees showed high levels of contentment in the practice while others disagreed that the hybrid program facilitated workplace communication, collaboration and engagement. For instance, 37.67% of employees totally disagreed that working from home does not affect functional communication and collaboration in the team.  

(AC 2.2) Present key findings for stakeholders from people practise activities and initiatives.

a. Percentage of each gender by type. Percentage of each gender by type.

The chart shows that male employees have a higher percentage of 53.85%, female employees at 45.38% and non-binary employees have 0.77%. This shows instances of gender inequality which could result in discrimination hence and lead to a decrease in productivity.

Table Two Findings

 Table Two Findings  

The feedback data above reveals that the company’s remote working policy is deficient or complete from the workers. This could be due to poor workplace associations, recognition lack, and inadequate resources during remote operations. For example, 155 employees strongly disagreed that they missed their colleagues at work while operating from home. Besides, 240 workers disagreed that they feel fully supported when working from home, while 147 workers complained that they cannot easily access resources while working from home. The above issues pose risks of job dissatisfaction, worker turnover, decreased team member engagement and decreased productivity. Furthermore, they sabotage the successful implementation of hybrid working in the entity.   

AC 2.3 Make justified recommendations based on evaluation of the benefits, risks and financial implications of potential solutions.

Recommendation for table 1- Diversity and inclusion program
Benefit
Diversity and inclusion in the workplace can positively complement the organizational structure, increasing the chances of innovation while boosting morale among employees (Banfield, Kay and Royles, 2018). 
Risk
However, there might be resistance to change, which may be a result of the poor attitude of some employees to change or lack of proper perception that the policy that is being changed is unfair. This could initially lead to the workers’ demotivation or even their resistance if not handled correctly (Banfield, Kay and Royles, 2018). 
Financial Implications
There could be a relatively high primary investment in training and mentorship programs, which must be launched (Banfield, Kay and Royles, 2018).


Table 2 recommendation 
Implement the best technology support system. 
Communication technology is an essential area to invest in, and this should entail efficient video conferencing, remote access systems, and collaborative software platforms for office-bound and working-from-home employees (Stewart and Brown, 2019). 
Benefit
The above can improve efficiency and work integration since any number of workers can work on a project without having to be in the same place. This has the overall effect of enhancing work satisfaction among employees due to the quality work-life balance (Stewart and Brown, 2019). 

Risk
However, initial resistance can probably be associated with challenges to introducing new technologies and possible cyber threats if the systems used are not protected adequately (Stewart and Brown, 2019). 
Financial Implications
There is also the problem of initial expenses associated with the acquisition and integration of new systems (Stewart and Brown, 2019). However, while implementing software availability and accessibility can be expensive in the short term, the long-term results, such as reduced office space and improved productivity, can be positive.

References

Banfield, P., Kay, R. and Royles, D. (2018). Introduction to Human Resource Management. [online] Google Books. Oxford University Press. Available at: https://books.google.co.ke/books?hl=en&lr=&id=DY9HDwAAQBAJ&oi=fnd&pg=PP1&dq=HR+management+book&ots=aomp5DTg1S&sig=ugxCcvkmR2iQPKs5l-P22TINo44&redir_esc=y#v=onepage&q=HR%20management%20book&f=false [Accessed 10 Jun. 2024].


Must Read: